Diagnostics and tracing
The diagnostics and tracing functionality provided by Series 40 and Symbian SDKs allows you to monitor the activities of a MIDlet as it is running in an emulator or, if you are using a Symbian SDK, on a Symbian device. You can monitor the following types of data:
Diagnostic data on the MIDlet's HTTP connections (requests and responses)
Tracing data returned by the MIDlet, for example, system output messages
Tracing data returned by the Java Runtime, for example, MIDlet runtime error messages
Tip: To receive tracing data from a MIDlet running on a Series 40 device, use the Series 40 On-Device Debugger.
The Java Runtime provides the following standard output streams for MIDlets to return tracing data:
Use the
System.outstream to trace the activities of the MIDlet while it is running. For example, you can set aSystem.outevent to be triggered when the user selects a certain menu item. To write a line of output data, use theSystem.out.printlnmethod.Use the
System.errstream to display error messages and other important information. To write a line of output data, use theSystem.err.printlnmethod.
System.out and System.err outputs
are generated both in the emulator and on the device.
Monitoring in an emulator
To monitor a MIDlet in a Series 40 or Symbian emulator:
Run the MIDlet in the emulator. You can run the MIDlet by launching it directly from the emulator, from an IDE integrated with the emulator, or from the command line.
For more information about different launch options, see the SDK documentation.
Open the diagnostics window to access the diagnostic and tracing data for the MIDlet.
Monitoring on a Symbian device
If you are using a Symbian SDK, you can monitor a MIDlet as it is running on a Symbian device.
Note: Make sure to use the correct SDK release for the device. The SDK platform must support the same Java Runtime for Symbian version as the device. For example, if you want to monitor the MIDlet on a device with Java Runtime 2.1 or 2.2 for Symbian, use a Symbian^3 SDK, or if you want to monitor the MIDlet on an S60 3rd Edition FP2 device, use an S60 3rd Edition FP2 SDK.
To monitor a MIDlet on a Symbian device:
Connect the device to a computer. The supported connection types are Bluetooth, USB, and WLAN. For more information about establishing a connection, see the SDK documentation.
Install the EcmtAgent onto the device. If you are using an S60 5th Edition or earlier SDK, the installation additionally stores the
RedMIDlet.jarfile in the installation files folder on the device.On an S60 5th Edition device with Java Runtime 1.x for S60 or an earlier device, open the application manager and install the RedMIDlet. You do not need to install the RedMIDlet onto a device that supports Java Runtime 2.1 for Symbian or newer.
On the device, launch the EcmtAgent and select the appropriate connection type from Options > Settings > Bearer.
Note: Keep the EcmtAgent running throughout the monitoring session.
On the computer, launch the Device Connectivity Tool.
In the Device Connectivity Tool, select the correct connection and click Connect. After the connection is established, the EcmtAgent and Device Connectivity Tool both change their status to "Connected".
On an S60 5th Edition device with Java Runtime 1.x for Symbian or an earlier device, launch the RedMIDlet. The device now redirects any tracing data to the computer.
Note: Do not close the EcmtAgent in order to launch the RedMIDlet. Instead, move the EcmtAgent to the background.
Open the IDE, open the MIDlet project, and set the SDK configuration to SymbianDevice.
Launch the MIDlet from the IDE. The MIDlet is installed onto the device, where you can now test it.
Tip: You can also launch the MIDlet from the command line. For more information, see the SDK documentation.
In the Device Connectivity Tool, select Tools > Diagnostics. The diagnostics window opens and you can now view the diagnostic and tracing data for the MIDlet.
Tip: You can also view the tracing data in the IDE console. If you launched the MIDlet from the command line, the command console also displays the tracing data.
After you have finished testing the MIDlet, close it on the device. The MIDlet is uninstalled from the device.
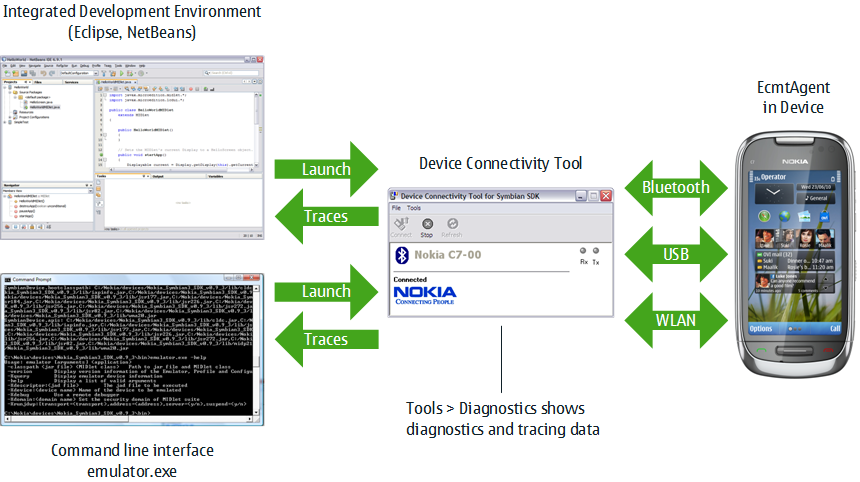
The following figure shows the diagnostics and tracing setup for Symbian^3 devices.

Figure: Diagnostics and tracing setup for Symbian^3 devices