Diagnostics window
Series 40 and Symbian emulators provide a diagnostics window that allows you to monitor different types of runtime data from the emulator. If you are using a Symbian SDK, the diagnostics window also allows you to monitor runtime data from a Symbian device by way of the Device Connectivity Tool.
To open the diagnostics window from the emulator, select Tools > Diagnostics.


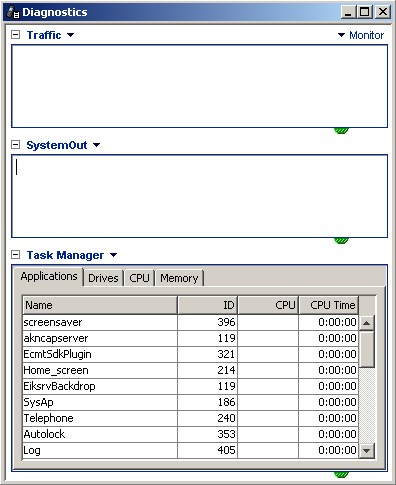
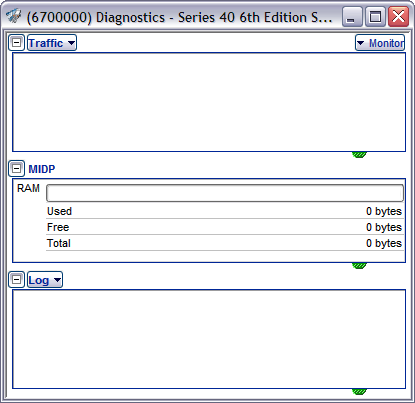
Figure: Diagnostics windows in a Symbian Belle emulator (left) and Series 40 6th Edition FP1 emulator (right)
The diagnostics window displays data in panes. Both Series 40 and Symbian emulators provide the following types of data for monitoring a running MIDlet:
Diagnostic data on the MIDlet's HTTP connections (Traffic pane)
Tracing data returned by the MIDlet or the Java Runtime, for example, system output messages or MIDlet runtime error messages (Log / SystemOut pane)
Series 40 emulators additionally display data about the MIDlet's memory consumption (MIDP pane), while Symbian emulators display detailed data about the emulator’s runtime state (Task Manager pane).
For more information about the displayed data, see the Series 40 or Symbian SDK documentation.