Location Simulation
The Location Simulation tool allows you to simulate geographical movement of a Nokia device. Location Simulation can be launched as shown in the screenshot below:
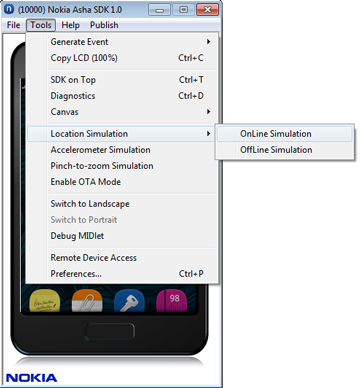
Figure: Location simulation
Location Simulation supports two simulation modes:
OnLine Simulation: Uses online Nokia maps
OnLine Simulation: Uses online Nokia maps
Any route can be drawn on the left pane of the Location Simulation
canvas, the corresponding co-ordinates are saved in a file <SDK Installation Dir>\bin\storage\< Emulator Instance ID>E\GPS\coord.sps. When you draws the route, the corresponding co-ordinate field values
(longitude and latitude) are updated automatically in the UI elements
on the right side.
To draw a route on the canvas using a mouse pointer you have to click on the canvas to specify a route. The Route map is drawn automatically from one point to the other.
Note: While using online editor, right-click on the map area to create a location point.
While running any MIDlet which uses JSR 179 Location API 1.0 to get current location in the emulator, the saved co-ordinates are returned to the MIDlet at regular intervals.
Plot view (OffLine Simulation): You can use this view to plot map and track the movement on the plotted map by marking points using the following widgets provided.
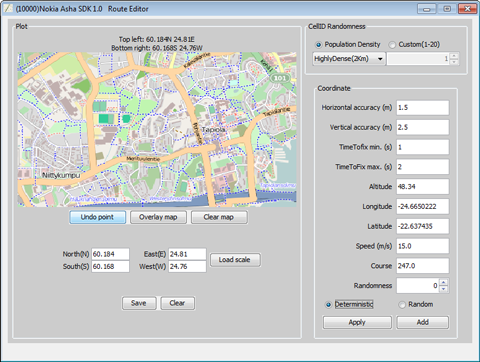
Figure: OffLine simulation
Option
Description
Load scale
The combination of this widget with an overlay map defines the exact location to be simulated. To load the scale you need to enter the exact coordinates (North-South Latitude and East-West longitude) of the overlaid map and press the Load button.Overlay map
You can load any desired map on the plot panel using this widget. There are many open sites where a map can be imported for this purpose, example http://www.openstreetmap.org/. Once a map is loaded you can click on the map to mark his/her location. Marked points are treated as the route, which is simulated while running the MIDlet using JSR 179 Location API 1.0.
Undo point
You can remove the previously marked point by clicking on the button.
Clear map
Use this option to remove the loaded map from the plot panel.
Save
By default, the configuration file is saved in
<SDK
Installation Dir>\bin\storage\< Emulator Instance ID>E\GPS\coord.sps
. If you want to save it in a different location, use this option.Clear
Use this option to clear the map and the configuration set.
Coordinate view (OnLine Simulation): The values Horizontal accuracy, Vertical accuracy, Time to fix min. (s), Time to fix max. (s), Altitude, Longitude, Latitude, Speed (m/s), Course and Randomness gets automatically populated for the first time as per your selection (right-click) on the map. From the next instance, only the Longitude and Latitude values are automatically updated depending upon your selection (right-click) on the map.
You can explicitly modify any value in the Coordinate section. This gets updated in the configuration file
(coord.sps)once you click on Add button (add a new row in the configuration file) or Apply (updates the existing value in the configuration file).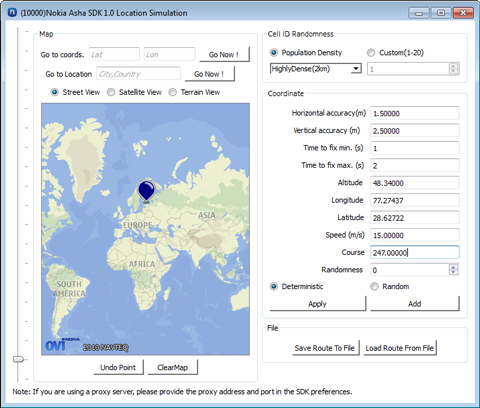
Figure: OnLine simulation
Option
Description
Go to coords
Use this option to specify the coordinate values Longitude, Latitude and click Go Now to view a specific location on the map, if you know the coordinates of that location.
Go to Location
Use this option and specify the name of the city, country or just the country name and click Go Now to view the map of a specific country or city.
Save Route To File / Load Route From File
Use the Save Route To File option to save the route to a file on your local drive and load it later using the Load Route From File option.
Street View / Satellite View / Terrain View
Use these options to switch between various map views, such as Street View / Satellite View / Terrain View.
Zoom in or out
Use the slider on the left corner to zoom the map in or out. Also, you can use the scroll button on your mouse to zoom the map in or out.
Undo Point
Use this option to undo a point that you have selected on the map.
ClearMap
Use this option to clear a route that you have selected on the map.
Once the API getLatitude(), getLongitude() and so on are called, the SDK location simulation gets these values
from the configuration file and return it to the API.
Note:
The range for Latitude measurements is 0 degree to (+/-)90 degrees.
The range for Longitude measurements is 0 degree to (+/-)180 degrees.
The range for Course measurements is 0 degree to 360 degrees.
Cell ID Randomness Simulation
Location Simulation also simulates the Cell ID Randomness for getting the co-ordinates using JSR 179 Location API 1.0 with CELLID as preferredMethods.
You can select the CellID Randomness settings to add randomness to the co-ordinates values already generated. For example, if you want to simulate "HighlyDense" area, select the HighlyDense(2Km) option from the Population Density drop down list. While running a MIDlet which uses CellID as preferredMethods for getting the location co-ordinates, 2Kms delta is added for the saved co-ordinates.
You can also set the randomness as a custom value (in km), which returns the co-ordinates with the selected value as delta.
Setting the Cell ID range
Open Location Simulation to see Cell ID Randomness as shown in the figure.
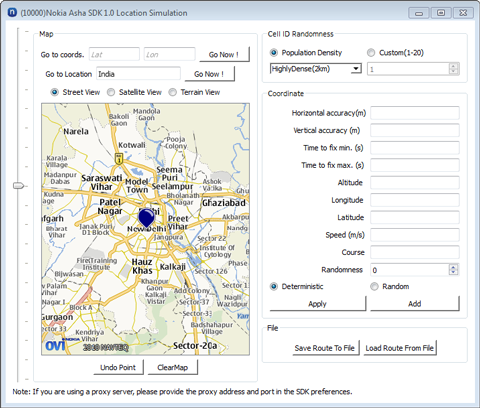
Figure: Location simulation
There are two radio buttons to set the Cell ID Range: Population Density and Custom. Select the Population Density radio button to select the predefined values as mentioned below:
HighlyDense for 2Km radius
MediumDense for 5Km radius
LowDense with for 10Km radius
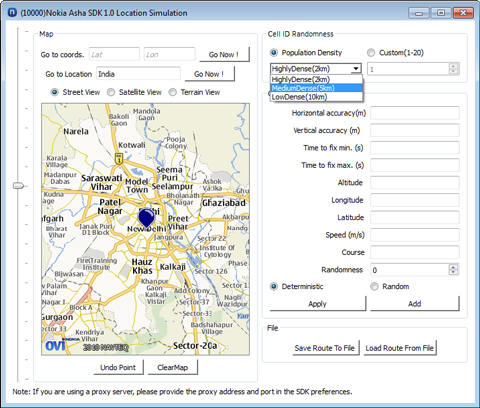
Figure: Cell ID randomness
Select the Custom radio button to set the custom value between 1 and 20 as shown in the figure.
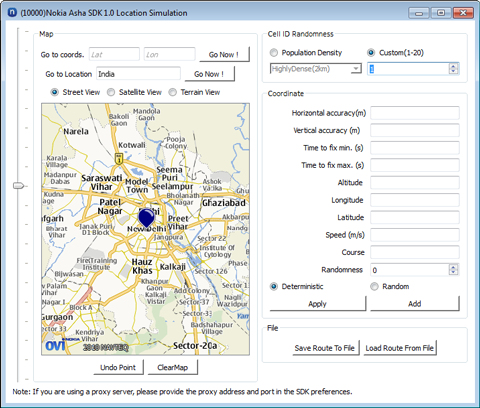
Figure: Setting the custom value