Setting up the IDE and debugging the MIDlet
Before you can use your IDE for debugging the MIDlet, you must configure its debugging settings. The following instructions apply to both debugging in an emulator and debugging on a device. The instructions are based on Eclipse Pulsar Helios and NetBeans IDE 6.9.1.
Note: If you are debugging on a device, you must first set up the device and the Device Connectivity Tool.
Debugging in Eclipse
To configure and perform debugging in Eclipse:
To configure the general debugging settings, select Window > Preferences.
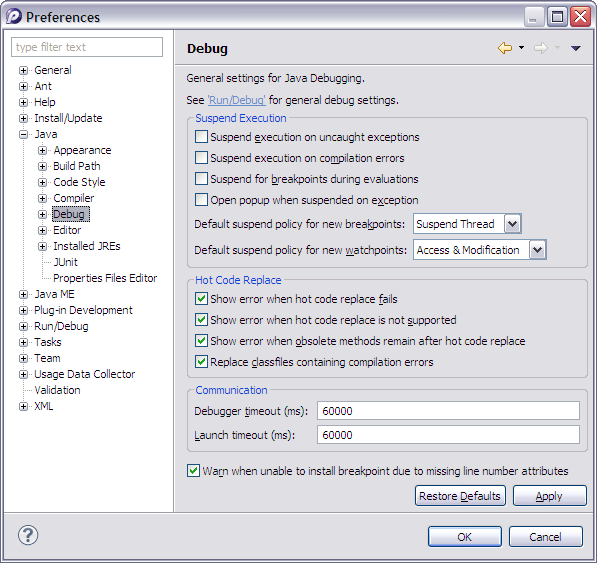
In the Preferences tree, select Java > Debug. Configure the following settings:
Uncheck Suspend execution on uncaught exceptions, Suspend execution on compilation errors, and Suspend for breakpoints during evaluations.
Set Debugger timeout (ms) and Launch timeout (ms) to "60000".

Figure: Correct debugging settings for Java
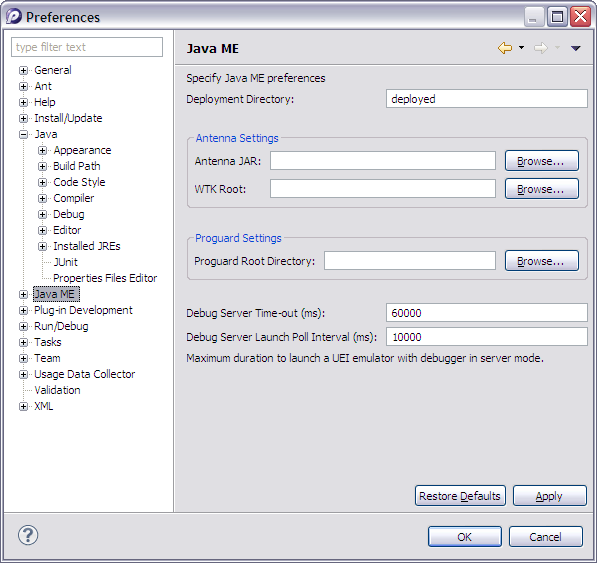
In the Preferences tree, select Java ME. Set Debug Server Time-out (ms) to "60000".

Figure: Correct debugging settings for Java ME
To save the settings, click OK.
Open the MIDlet project if it is not already open.
To create a debugging configuration for the MIDlet, select Run > Debug Configurations.
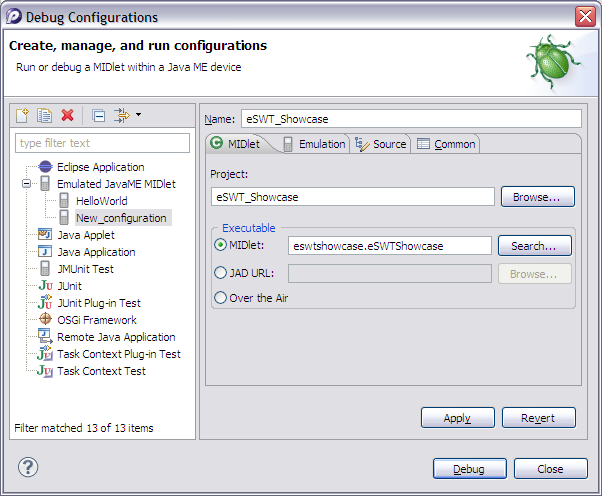
Select Emulated Java ME MIDlet, and click the New button.
Enter a Name for the debugging configuration.
In the MIDlet pane, select the Project and the MIDlet that you want to debug.

Figure: MIDlet settings in the debugging configuration
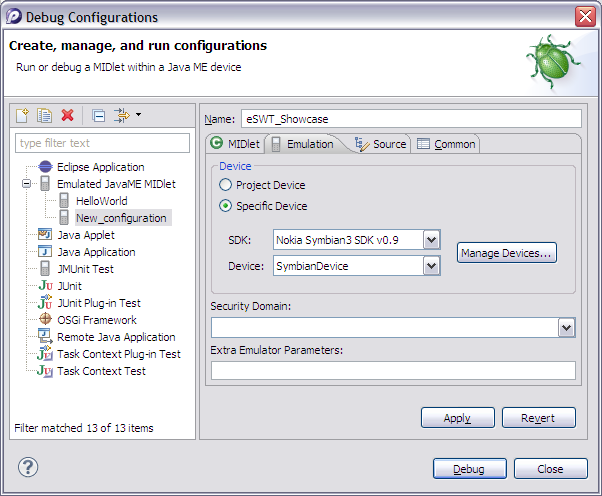
Open the Emulation pane.
Select Specific Device, select your Symbian SDK as the SDK, and select Device as follows:
If you want to debug the MIDlet in the emulator, select SymbianEmulator.
If you want to debug the MIDlet on a device, select SymbianDevice.

Figure: Emulator settings in the debugging configuration
To save the settings, click Apply.
To start debugging the MIDlet, click Debug.
The MIDlet is launched in the emulator or on the device, depending on its debugging configuration, and you can now use Eclipse to debug the MIDlet.
Now that you have created a debugging configuration, you can also debug the MIDlet by selecting it in the Package Explorer pane and selecting Run > Debug As > Emulated Java ME MIDlet.
Debugging in NetBeans
To configure and perform debugging in NetBeans:
Open the MIDlet project if it is not already open.
In the Projects pane, right-click the MIDlet project name, and select Properties.
In the Category tree, select Platform. Select your Symbian SDK as the Emulator platform, and select Device as follows:
If you want to debug the MIDlet in the emulator, select SymbianEmulator.
If you want to debug the MIDlet on a device, select SymbianDevice.
To save the configuration, click OK.
In the Projects pane, right-click the MIDlet project name, and select Debug to start the debug session.
If starting the debug session fails with the error message
Connection refuseddisplayed in the debugger console window:
The MIDlet is launched in the emulator or on the device, depending on its configuration, and you can now use NetBeans to debug the MIDlet.