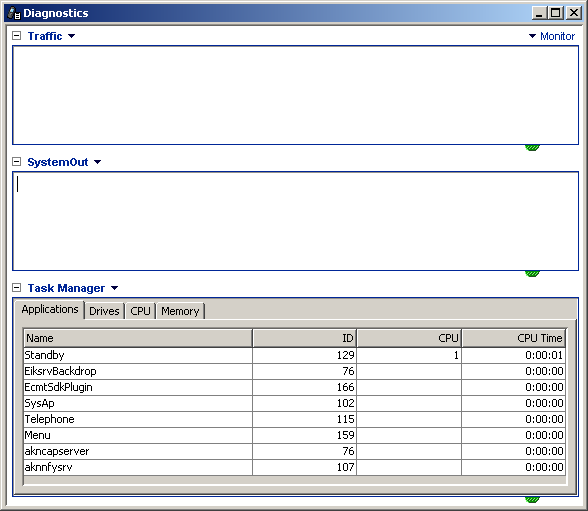
Diagnostics window
The Diagnostics window provides panes that display different diagnostics type data from the emulator or a device.
You can open the Diagnostics window from the emulator by selecting Tools > Diagnostics from the menu bar. It can also be opened from the Device Connectivity tool, in which case the window displays information from the connected device.

Figure: Diagnostics window
The Diagnostics window displays information in panes, which query the status of the MIDlet's memory usage, HTTP traffic, and other events.