Basic Log
The basic log has the following columns:
ID – Unique sequence number for events.
Type – Format of the communication content. 'System' means NCF specific operations.
Title – Communication event.
Size – Size of the log event in bytes.
Source – Source of a log event; most often a product that sends data.
Target – Target of a log event.
Time – System time of the operation occurrence.
You can sort log entries in ascending or descending order depending on the content of each column. Sort function makes it easier to examine certain kinds of communication operations.
You can clear the log information by selecting View | Clear Log from the menu bar. The Clear function affects all log views in the user interface. Log files are not cleared.
Communication errors are displayed with white text on red background. Warnings are displayed with black text on yellow background. Currently selected event row is displayed with white text on transparent blue background. The color of the selected error and warning row is a mixture of its own color and the transparent blue selection color.
You can view log details in one of the following ways:
Double-click a log row
Select a row and then select View | Log Details from the menu bar
Right-click a row and then select Log Details… from the context menu
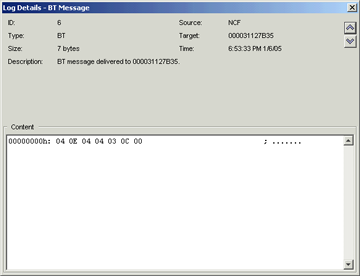
The basic log details are displayed in hexa mode (Figure 15). You can browse the log entries using the arrow buttons on the right side of the event definition.

Figure: Log Details