Debugging a MIDlet
Steps
Open the MIDlet class from the Package Explorer window and insert breakpoints wherever required.
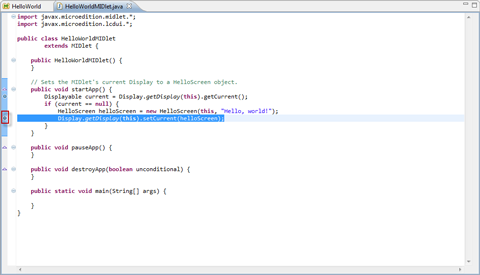
Figure: Package explorer window
- Right-click the
project and select Debug As.
Note:
If the configuration is not created, create the configuration by performing the steps explained in Running the MIDlet - Select either Emulated Java ME JAD, or Emulated Java ME MIDlet, or Debug Configurations, to start the debugging.
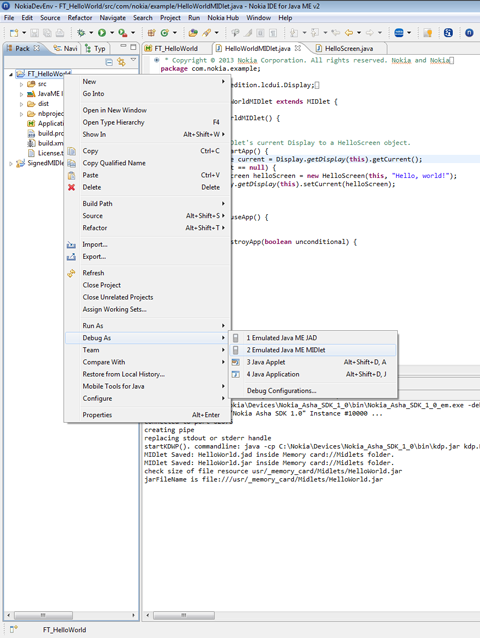
Figure: Debug configurations dialogue box
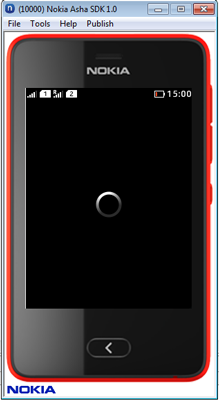
Figure: Debug in progress on Emulator
- Once the debug
is completed the figure below is displayed.
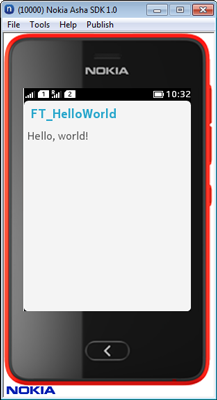
Figure: Debug on Emulator
Note:
Ctrl + K is the hot key used to kill the MIDlet as shown in the figure below.
Figure: MIDlet exited properly
Note:
To improve the performance of the debugger, select Windows > Preferences. In Preferences, select Java > Debug. Uncheck all the options under Suspend Execution and Hot Code Replace. Enter a higher value for Debugger timeout based on your machine performance and Emulator performance.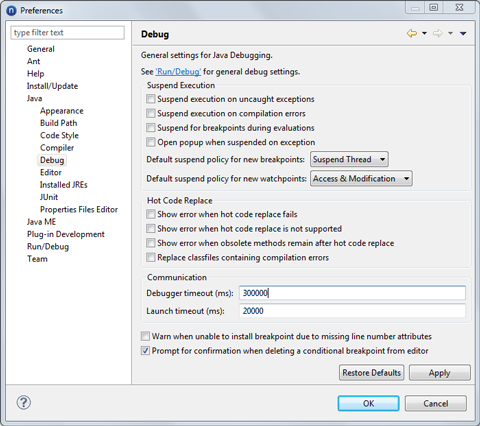
Figure: Enter the Preferences