Debugging a MIDlet
You can debug MIDlets using either one of the following steps:
Steps
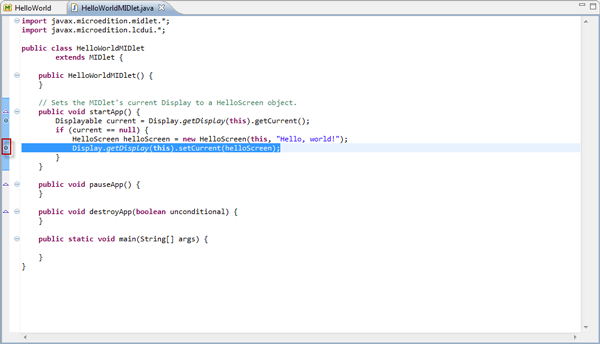
Select Tools >Debug MIDlet from the SDK Menu, browse to the MIDlet jar path and press Start Debugging, and insert breakpoints wherever required.

Figure: Debugging a MIDlet
Attach debugger on NetBeans/Debug configurations on Eclipse (or on Nokia IDE for Java ME) with the port 1234 for the MIDlet you are debugging.
Debugging using NetBeans
If you are debugging using NetBeans, follow the steps below:
From the Debug menu, select Attach Debugger.
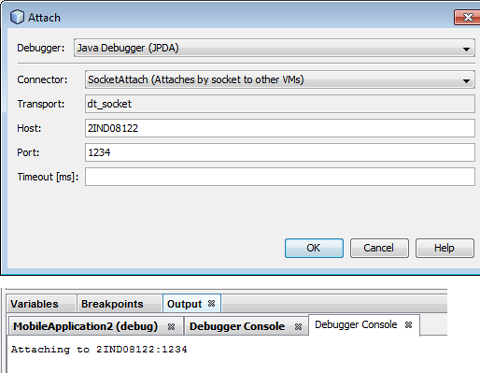
In the Attach dialogue box, ensure that the following values are selected/specified and click OK:
Debugger: Java Debugger (JPDA)
Connector: Socket Attach
Transport : dt_socket
Host: <Host_Name>
Port : <Port> as specified in the run.bat file, for example 1234.
Once NetBeans is connected to the port, in the Output-Debugger Console you can see messages like
“Attaching to 2INN00315:1234”.

Figure: Output debugger console
Debugging using Eclipse / Nokia IDE for Java ME (Eclipse)
Set the MIDlet you want to debug as the main project.
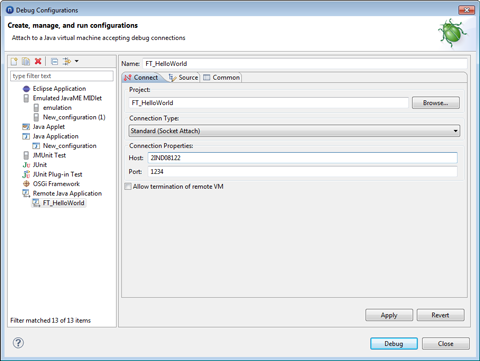
From the Run menu, select Debug Configurations.
Right-click on Remote Java Application and select New to create a new configuration.

Figure: Debug Configuration
Select the Connection Type as select Standard (Socket Attach).
Specify the Port to debug (which should be same as the port in the run.bat file, example 1234) and click Debug.
Eclipse waits for the connection to be established.

Figure: Progress bar