Setting up the IDE and debugging the MIDlet
Before you can use an IDE for debugging a MIDlet, you must configure its debugging settings. The following instructions apply to debugging in a Series 40 or Symbian emulator and debugging on a Symbian device. The instructions are based on Eclipse Pulsar Helios and NetBeans IDE 6.9.1. For instructions on how to debug a MIDlet on a Series 40 device, see section Debugging on a Series 40 device.
Note: If you are debugging on a Symbian device, you must first set up the device and the Device Connectivity Tool.
Debugging in Eclipse
To configure and perform debugging in Eclipse:
To configure the general debugging settings, select Window > Preferences.
In the Preferences tree, select Java > Debug and configure the following settings:
Uncheck Suspend execution on uncaught exceptions, Suspend execution on compilation errors, and Suspend for breakpoints during evaluations.
If you are debugging in a Series 40 emulator, also uncheck Open popup when suspended on exception.
If you are debugging in a Series 40 emulator, set Debugger timeout (ms) to "30000" and Launch timeout (ms) to "20000".
If you are debugging in a Symbian emulator or on a Symbian device, set Debugger timeout (ms) and Launch timeout (ms) to "60000".
Tip: Depending on the speed of your computer, the time-out values can be greater or smaller. To find the optimal configuration for your computer, try different values. When the values are too small, the SDK freezes when you try to debug a MIDlet.
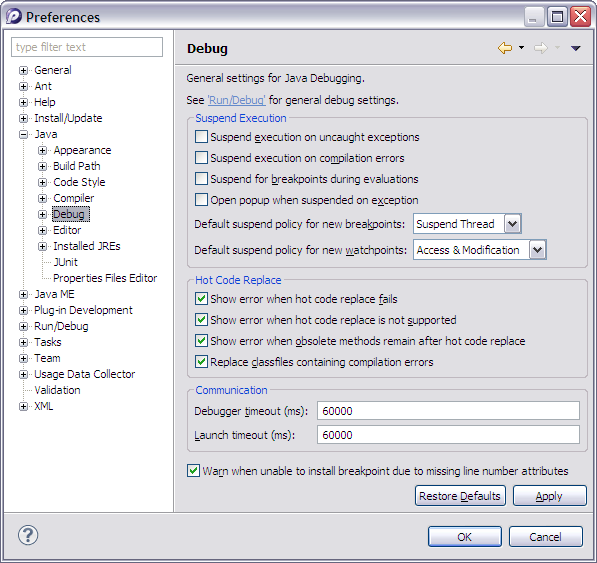
Figure: Correct Java debugging settings for Symbian
In the Preferences tree, select Java > Compiler and check Use default compliance settings.
If you are debugging in a Symbian emulator or on a Symbian device, select Java ME from the Preferences tree and set Debug Server Time-out (ms) to "60000".
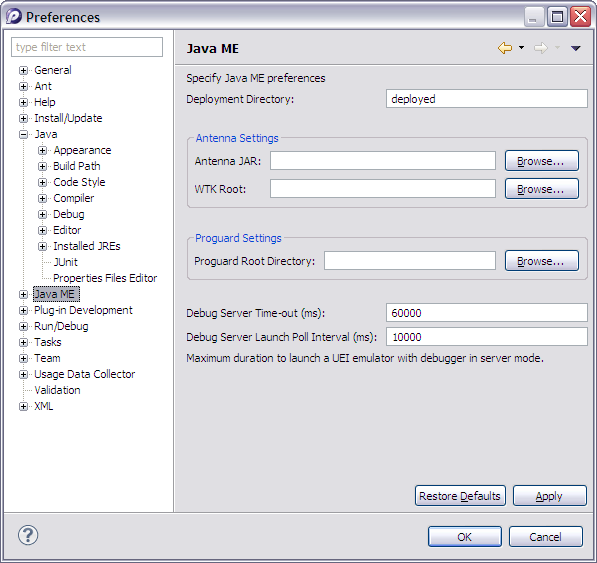
Figure: Correct Java ME debugging settings for Symbian
To save the settings, click OK.
Open the MIDlet project if it is not already open.
To create a debugging configuration for the MIDlet, select Run > Debug Configurations.
Select Emulated Java ME MIDlet and click the New button.
Enter a Name for the debugging configuration.
In the MIDlet pane, select the Project and the MIDlet that you want to debug.

Figure: MIDlet settings in the debugging configuration
Open the Emulation pane.
Select Specific Device, select the Series 40 or Symbian SDK as the SDK, and, if you selected the Symbian SDK, select Device as follows:
If you want to debug the MIDlet in the Symbian emulator, select SymbianEmulator. If you are using an S60 5th Edition or earlier SDK, select S60Emulator.
If you want to debug the MIDlet on a Symbian device, select SymbianDevice. If you are using an S60 5th Edition or earlier SDK, select S60Device.
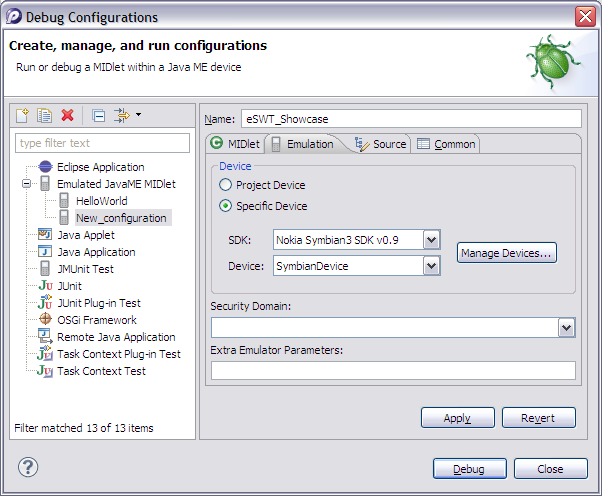
Figure: Configuring the emulation settings for a Symbian device
To save the settings, click Apply.
To start debugging the MIDlet, click Debug. If you are debugging in a Symbian emulator or on a Symbian device, the SDK progress window opens and shows the progress of starting the debug session.

Figure: Debug session startup
The MIDlet is launched in the emulator or on the Symbian device, depending on its debugging configuration, and you can now use Eclipse to debug the MIDlet.
Tip: Now that you have created a debugging configuration for the MIDlet, you can debug the MIDlet by selecting it in the Package Explorer pane and selecting Run > Debug As > Emulated Java ME MIDlet.
Debugging in NetBeans
To configure and perform debugging in NetBeans:
Open the MIDlet project if it is not already open.
In the Projects pane, right-click the MIDlet project name and select Properties.
In the Category tree, select Platform. Select the Series 40 or Symbian SDK as the Emulator platform and, if you selected the Symbian SDK, select Device as follows:
If you want to debug the MIDlet in the Symbian emulator, select SymbianEmulator. If you are using an S60 5th Edition or earlier SDK, select S60Emulator.
If you want to debug the MIDlet on a Symbian device, select SymbianDevice. If you are using an S60 5th Edition or earlier SDK, select S60Device.
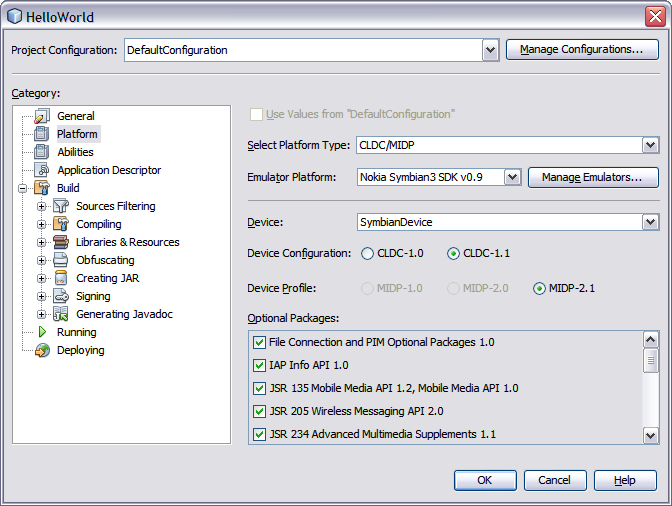
Figure: Configuring a MIDlet for debugging on a Symbian device
To save the configuration, click OK.
In the Projects pane, right-click the MIDlet project name and select Debug to start the debug session. If you are debugging in a Symbian emulator or on a Symbian device, the SDK progress window opens and shows the progress of starting the debug session.
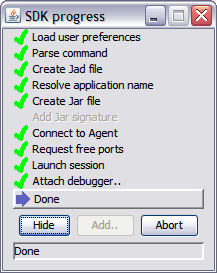
Figure: Debug session startup
If starting the debug session fails with the error message
Connection
refused
displayed in the debugger console window, manually attach a debugger to the MIDlet:Select Debug > Attach Debugger.
Specify the Host and Port. Use the values displayed in the debugger console window.
Click OK to start the debug session.
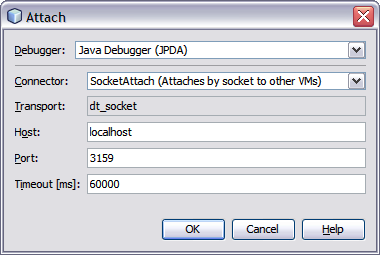
Figure: Attaching a debugger to a MIDlet
The MIDlet is launched in the emulator or on the device, depending on its configuration, and you can now use NetBeans to debug the MIDlet.