Debugging
Debugging is the process of methodically finding and fixing defects in your application. You typically perform debugging with a specialized debugger tool. Both Eclipse and NetBeans provide a debugger that you can use with MIDlets. You can debug a MIDlet in an emulator or on a device.
Debugging in an emulator
To debug a MIDlet in an emulator, set up the IDE and run the debugger. After the IDE has launched the debugger and the MIDlet is running in the emulator, use the IDE for debugging the MIDlet.
Debugging on a device
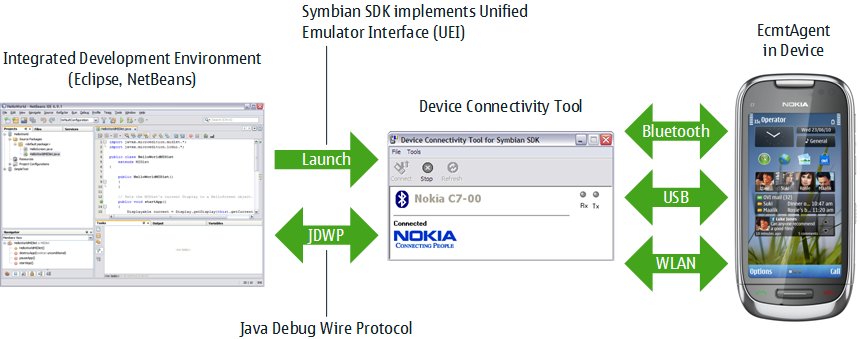
On-device debugging (ODD) is an advanced and precise method for debugging MIDlets directly on a device. ODD is supported from S60 3rd Edition FP2 onwards. S60 5th Edition and S60 3rd Edition FP2 support ODD over WLAN. From Symbian^3 onwards, Symbian devices support ODD over Bluetooth, USB, and WLAN.
Note: Make sure to use the correct SDK release for the device. The SDK platform must support the same Java Runtime version as the device. For example, if you want to monitor the MIDlet on a device with Java Runtime 2.1 or 2.2, use a Symbian^3 SDK, or if you want to monitor the MIDlet on an S60 3rd Edition FP2 device, use an S60 3rd Edition FP2 SDK.
To debug a MIDlet on a device:
After the IDE has launched the debugger and the MIDlet is running on the device, use the IDE for debugging the MIDlet.
The following figure shows the ODD setup for Symbian^3 devices.

Figure: ODD setup for Symbian^3
For detailed instructions on debugging a MIDlet from Eclipse or NetBeans over a WLAN connection, see How to configure Java ODD over WLAN with Eclipse and NetBeans IDEs on Forum Nokia.