Using the Diagnostics window
The Diagnostics window displays information that can help you determine whether the content on the SDK is working properly. To view the Diagnostics window, make sure the Diagnostics windows is enabled (see Overview to setting the general behaviors of the SDK).
To use the Diagnostics window:
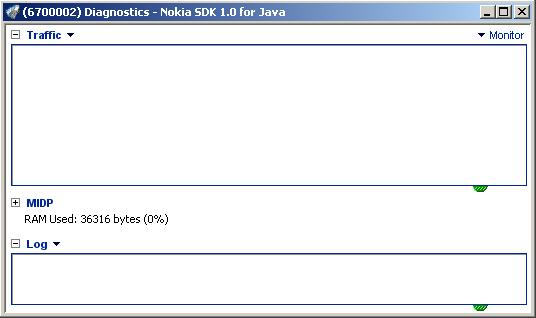
Select Tools > Diagnostics. The Diagnostics window appears:

Select the appropriate view to see the information you want:
To see Look at this view Information about requests to and responses from the Internet Traffic See Analyzing SDK traffic and events Information about KVM status MIDP See Viewing information about the MIDP Java KVM Messages generated by the SDK Log See Viewing SDK logs
To display only the selected views:
Right-click in the Diagnostics window and select Views from the menu that appears. A list of views appears.
Uncheck the views you do not want to see. The checked views expand to fill the space of the Diagnostics window.
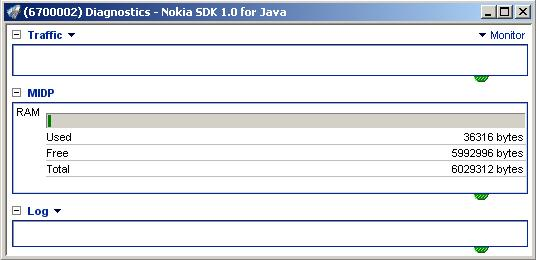
You can open, close, and adjust the size of a view. The following figure illustrates an example of the Diagnostics window with an open MIDP view:
